 ar
ar bg
bg hr
hr cs
cs da
da nl
nl fi
fi fr
fr de
de el
el hi
hi it
it ko
ko no
no pl
pl pt
pt ro
ro ru
ru es
es sv
sv tl
tl iw
iw id
id lv
lv lt
lt sr
sr sk
sk sl
sl uk
uk vi
vi et
et hu
hu th
th tr
tr fa
fa ms
ms hy
hy ka
ka ur
ur bn
bn mn
mn ta
ta kk
kk uz
uz ku
ku
Visualization Software
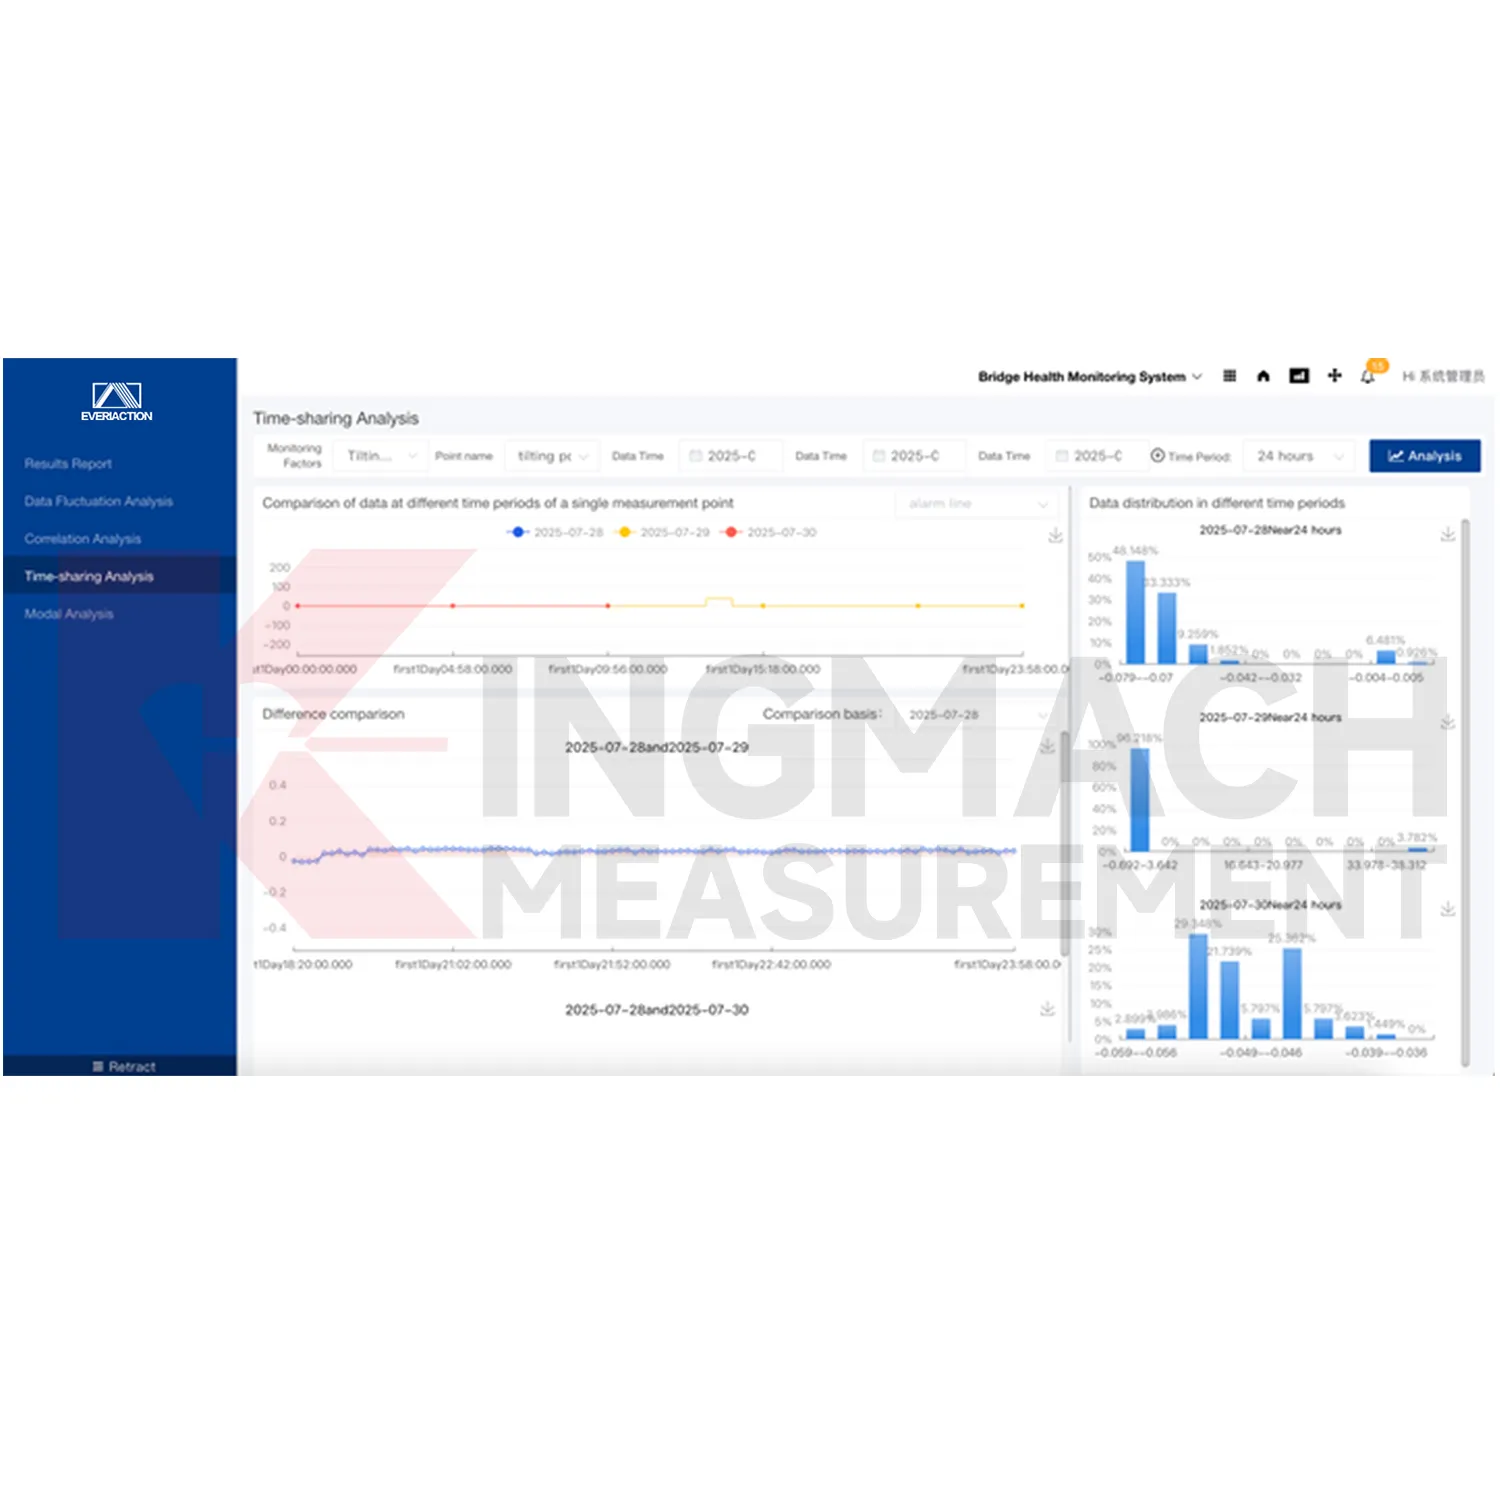
Kingmach Visualization Software refers to the Monitoring system software platform, also described in the local files as the Cloud Platform. It is based on Internet of Things, big data, and cloud computing technologies for all-round monitoring of civil engineering structure safety. The platform receives data from monitoring devices, stores it, filters it, analyzes it, displays it, and supports project management. It is intended for infrastructure and engineering assets where multi-source readings need to be reviewed together instead of scattered across separate devices or spreadsheets.
Application of Visualization Software
Slope monitoring benefits from Kingmach Visualization Software because slope risk often depends on several data types at once. Displacement, rainfall, groundwater, pore pressure, tilt, settlement, and inspection observations all need to be read together. A cloud-based platform can receive wired or wireless device data from field points that are difficult to access. Trend analysis and visual display help users see whether movement follows rainfall, construction disturbance, seasonal water changes, or a developing instability pattern.
The future of Visualization Software
Cybersecurity and data governance will become more visible around Kingmach Visualization Software. The local product file notes multiple security protocols and transmission methods. As monitoring data moves through cloud systems and remote access points, users will need clearer rules for account access, data storage, document control, alarm review, and report release. Strong governance helps protect the integrity of structural safety records and keeps responsibility clear across owners, operators, and engineering teams.
Care & Maintenance of Visualization Software
After software updates or configuration changes, Kingmach Visualization Software should be checked with a short acceptance routine. Confirm device connections, data storage, trend display, alarm rules, report generation, user access, and project document links. Compare a few channels with field records or acquisition device values to make sure nothing shifted during the update. Record the date, change type, user, and verification result. This keeps platform maintenance visible in the project history.
Kingmach Visualization Software
Kingmach Visualization Software makes reporting easier because monitoring evidence is already organized by project, device, channel, trend, alarm, and document. Registered experts can issue professional result reports through the platform workflow described in the local product file. For owners, reports need to explain what changed, where it happened, which instruments confirmed it, and what field action followed. A platform that stores data, filters records, generates visual trends, and keeps project documents together makes that reporting process more traceable than manual consolidation after the event.
FAQ
Q: How should a project be prepared?
A: Define asset folders, monitoring zones, measuring points, units, alert grades, and report needs before launch.
Q: What should be tested at go-live?
A: Test incoming values, time order, engineering units, graph refresh, alarm trigger, and export output.
Q: Why does alarm logic need review?
A: Different sensor categories and risk levels may need different limits, rates, and escalation steps.
Q: How should files stay current?
A: Update drawings, point lists, photos, inspection notes, maintenance logs, and reports when the site changes.
Q: What should follow a platform update?
A: Run a short acceptance check on live values, graph pages, alerts, exports, accounts, and stored files.
Reviews
Ryan Lewis
Fast delivery and excellent product quality. The accelerometers and tiltmeters are highly reliable. Strongly recommend this company.
Andrew Lee
The visualization software is intuitive and powerful. It helps us analyze monitoring data efficiently.
Latest Inquiries
To protect the privacy of our buyers, only public service email domains like Gmail, Yahoo, and MSN will be displayed. Additionally, only a limited portion of the inquiry content will be shown.
Amelia***@gmail.comSingapore
Hello, I am looking for visualization software for monitoring system data analysis. Please let me kn...
Olivia***@gmail.comUnited States
Hello, we are currently sourcing high-precision strain gauges and load cells for a bridge monitoring...
Related product categories
- Monitoring Software Suite
- Monitoring system software platform
- Environmental Monitoring
- Visualization Software
- GPS Displacement Monitoring System
- Integrated Monitoring Station
- Settlement Monitoring Rod
- Structural Health Monitoring (SHM) System
- Structural Monitoring Cloud Platform
- IoT Online Monitoring System
- Monitoring System Platform & Services
- Engineering Pulse Intelligent Monitoring Cloud Platform