 ar
ar bg
bg hr
hr cs
cs da
da nl
nl fi
fi fr
fr de
de el
el hi
hi it
it ko
ko no
no pl
pl pt
pt ro
ro ru
ru es
es sv
sv tl
tl iw
iw id
id lv
lv lt
lt sr
sr sk
sk sl
sl uk
uk vi
vi et
et hu
hu th
th tr
tr fa
fa ms
ms hy
hy ka
ka ur
ur bn
bn mn
mn ta
ta kk
kk uz
uz ku
ku
Temperature String
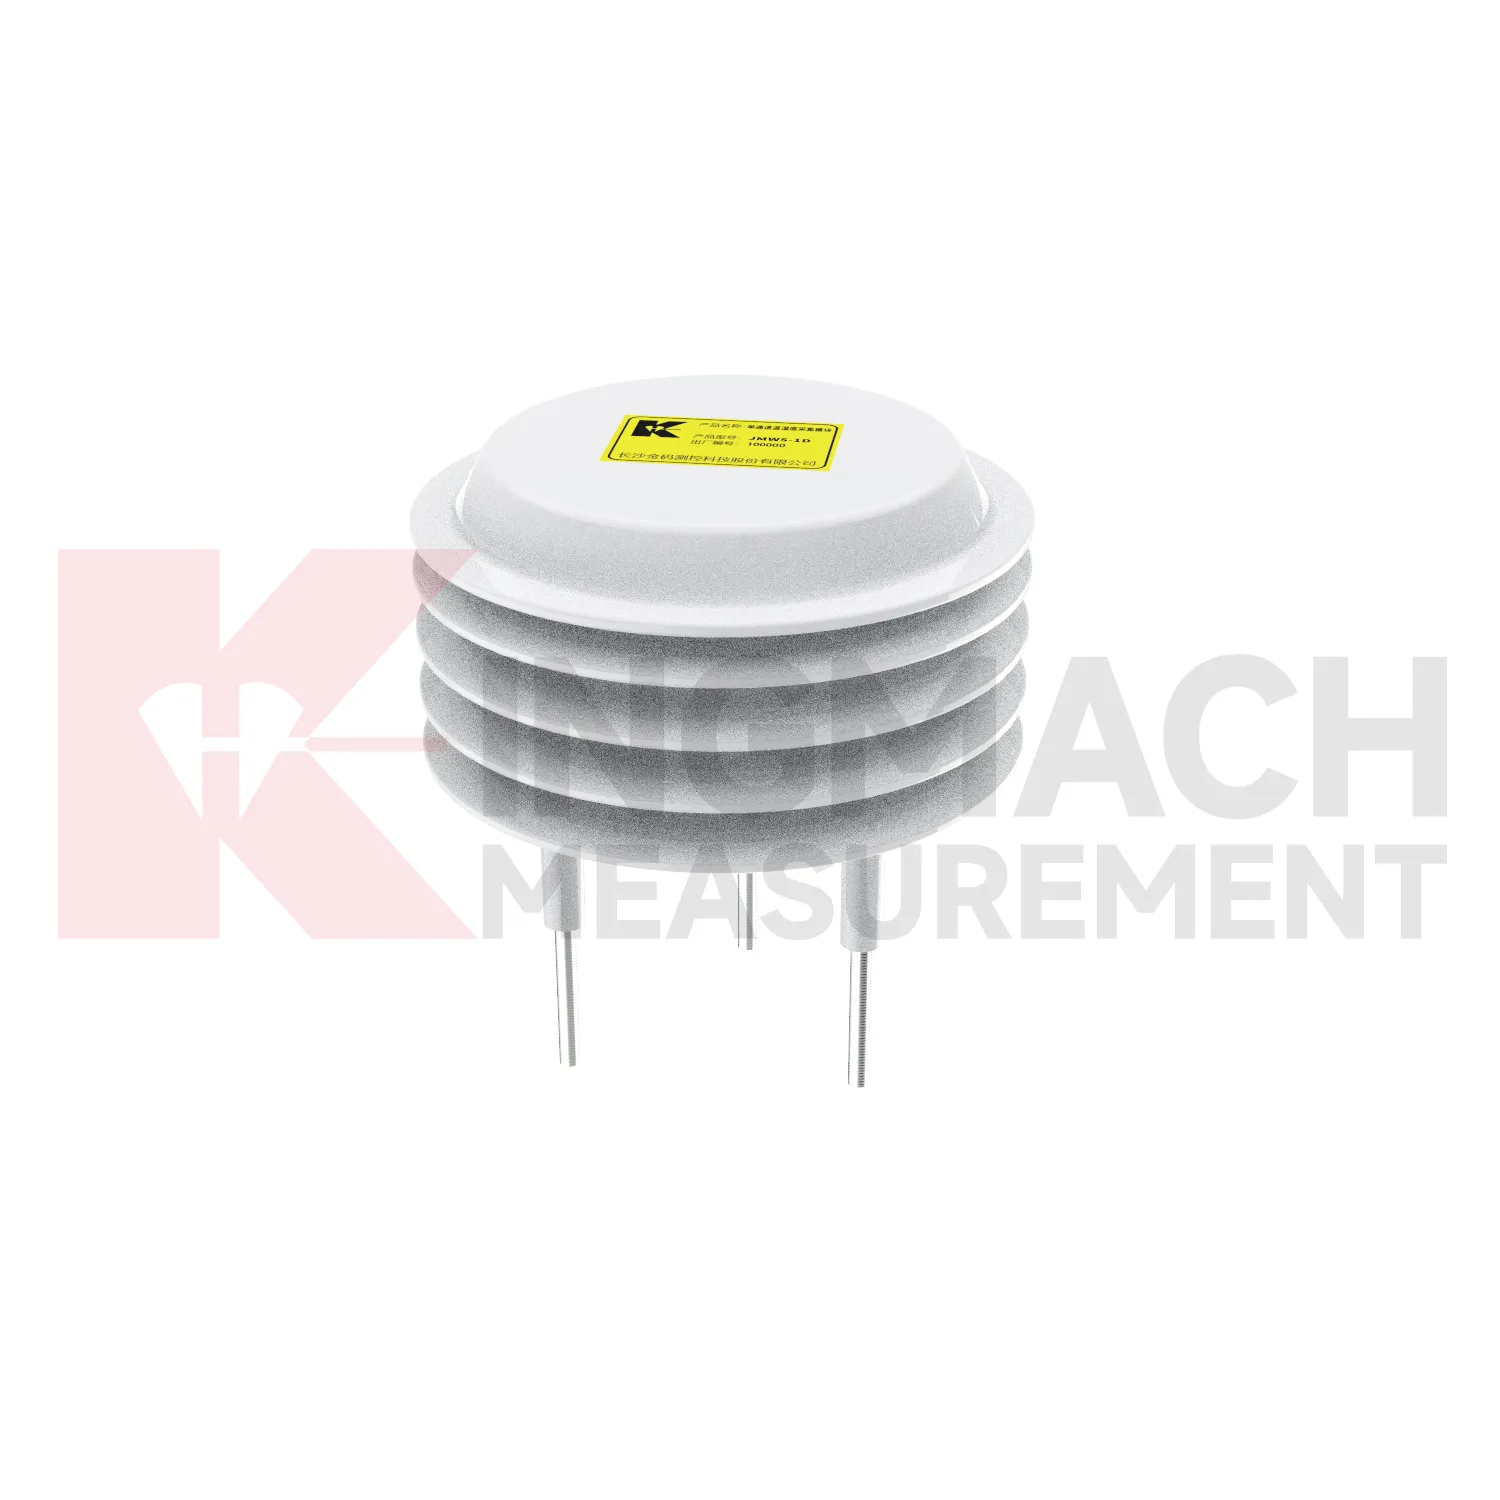
Air temperature and humidity monitoring in Kingmach Temperature String is useful wherever the environment affects people, equipment, cabinets, sensors, or structural interpretation. Underground stations, tunnels, shopping areas, factories, mines, construction zones, and equipment rooms can change quickly after ventilation adjustments, water entry, heating, cooling, or heavy site activity. A temperature and humidity point should be placed where it represents the condition being reviewed, not simply where installation is easy. If the target is a cabinet, the point belongs near the cabinet environment. If the target is an occupied or underground space, the placement should reflect airflow and working conditions. These records help explain condensation, corrosion, electrical faults, concrete curing context, and changes in other sensor readings. They are also useful for maintenance scheduling because repeated high humidity or heat exposure can shorten the life of connectors, enclosures, and acquisition equipment.
For owners, the strongest record is the one that remains understandable after staff changes. Clear units, plain point names, installation photos, maintenance notes, and linked structural channels make the data usable beyond the original project team.
For field teams, this point is most useful when the record shows the condition before the structural response, during the response, and after the site returns to routine operation. The note should include weather timing, inspection access, nearby construction, and whether the linked structural points changed in the same period.

Application of Temperature String
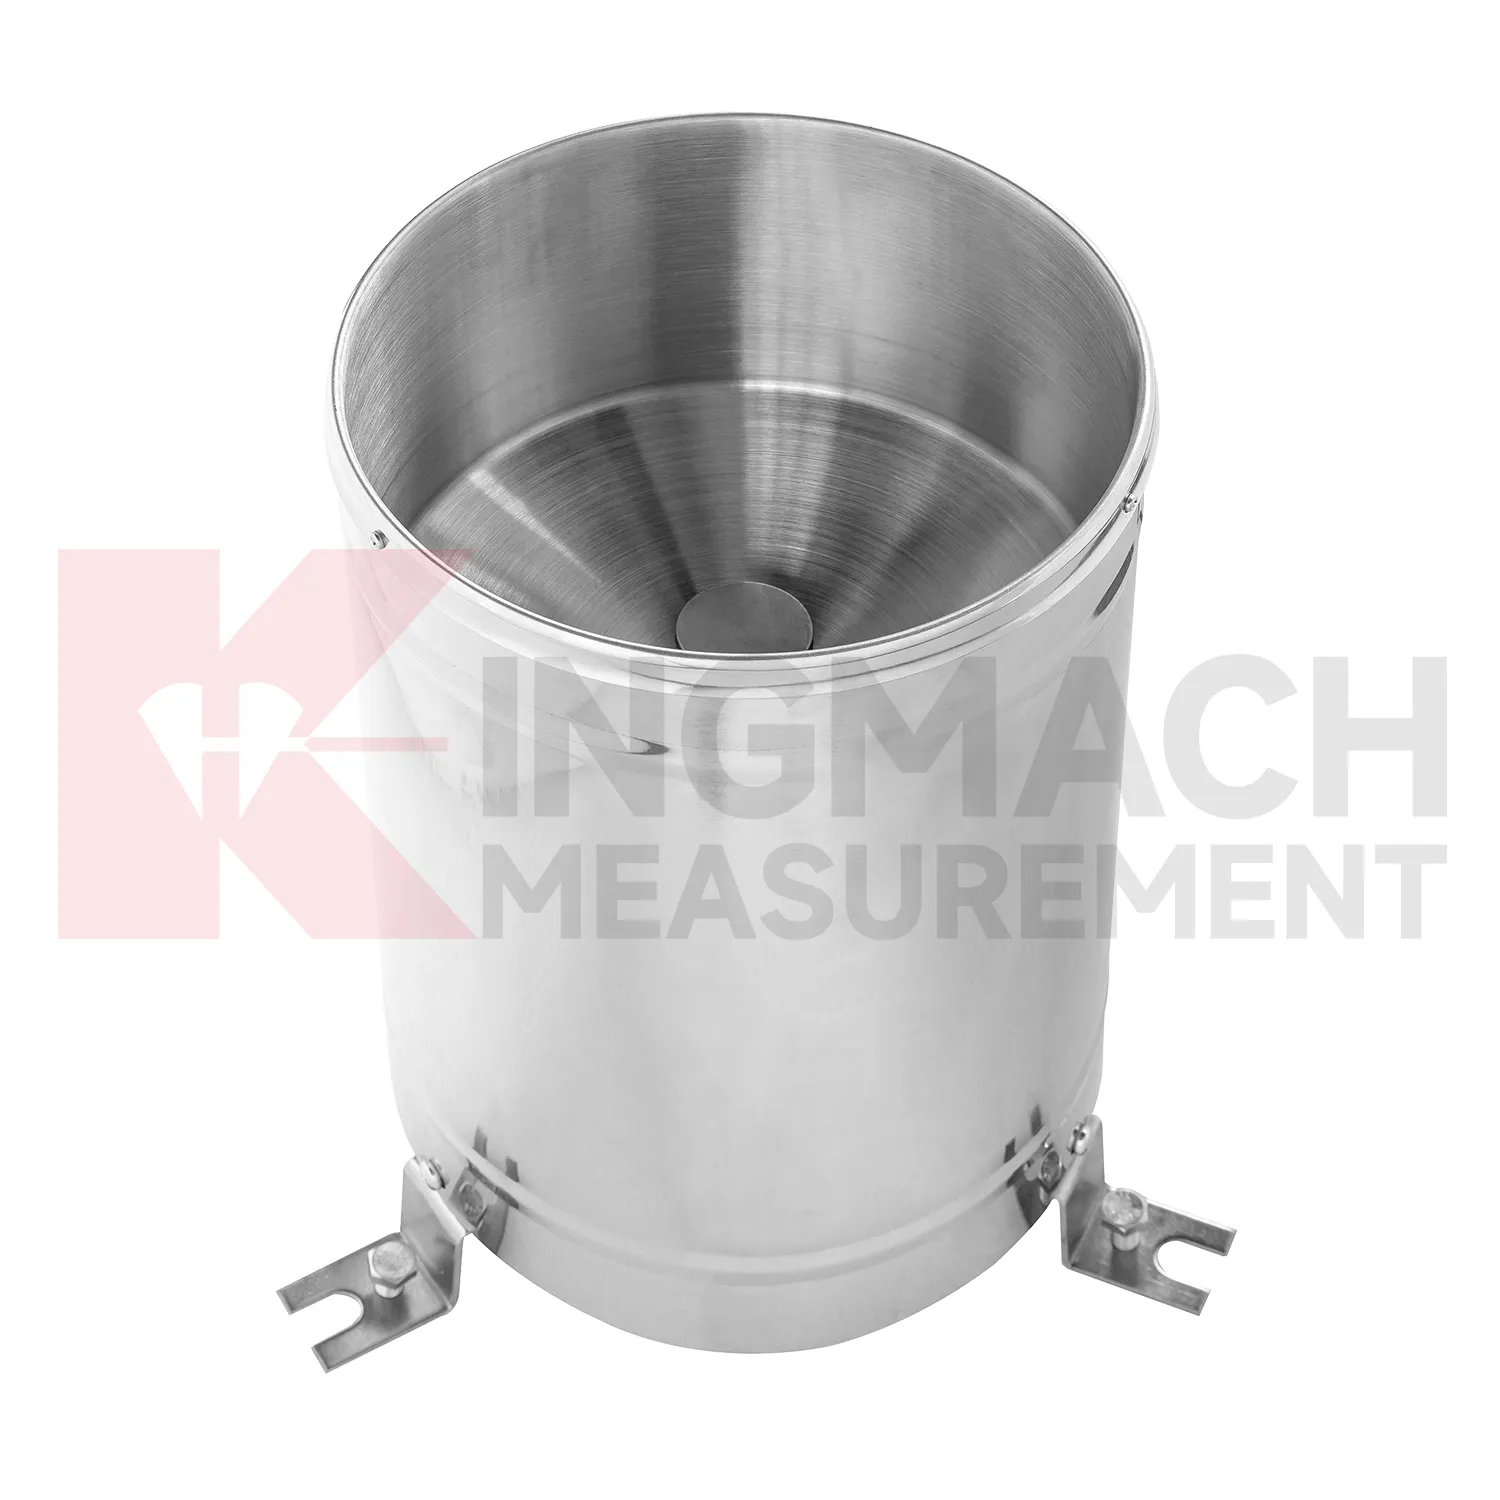
Urban environmental stations use Kingmach Temperature String to support infrastructure management across bridges, tunnels, public buildings, drainage areas, transport corridors, and exposed equipment sites. A station may record rain, wind, air temperature, humidity, pressure, or soil wetness depending on the risk being managed. The most important design rule is representativeness. A rain point blocked by a roof edge, a wind point sheltered by a wall, or a humidity point hidden in an unrelated cabinet can mislead users. Public infrastructure data may be reviewed by many teams, so units, point names, installation photos, and maintenance notes must be clear. A well-run station helps connect environmental change to inspections, drainage response, traffic planning, and structural monitoring.
Long-term value comes from consistency. A channel that keeps the same location, unit, maintenance history, and linked asset record can support seasonal comparison, post-storm review, and handover between construction and operation teams.
Maintenance teams should record cleaning, access difficulty, enclosure condition, cable repair, vegetation growth, nearby equipment changes, and the first normal reading after work. Those notes protect the meaning of the curve when old data is reviewed months later.
The environmental point should be part of a named monitoring question. It may explain wetting, drying, wind exposure, thermal movement, cabinet stress, or pressure variation, but that purpose needs to be visible in drawings and reports.
The future of Temperature String
Digital handover will be a larger future requirement for Kingmach Temperature String. Environmental stations may remain in service long after construction ends, but their usefulness depends on knowing where each point is, what it measures, and why it was installed. A handover file should include location photos, unit definitions, mounting details, exposure notes, cable routes, power source, first stable reading, and linked structural records. Without this context, future reviewers may not know whether a station represents a slope, a cabinet, a bridge deck, or a general weather condition. A good handover keeps environmental data understandable across staff changes and maintenance cycles.
A good review habit is to compare the condition channel with the nearest asset behavior instead of reading it as a standalone weather value. That keeps the record tied to slope movement, bridge response, tunnel equipment, dam seepage, drainage behavior, or cabinet reliability.
The installation file should explain why the location represents the monitored area. If the point is sheltered, shaded, exposed, buried, elevated, or placed inside an enclosure, that fact changes how later readings should be understood by maintenance staff.
Care & Maintenance of Temperature String
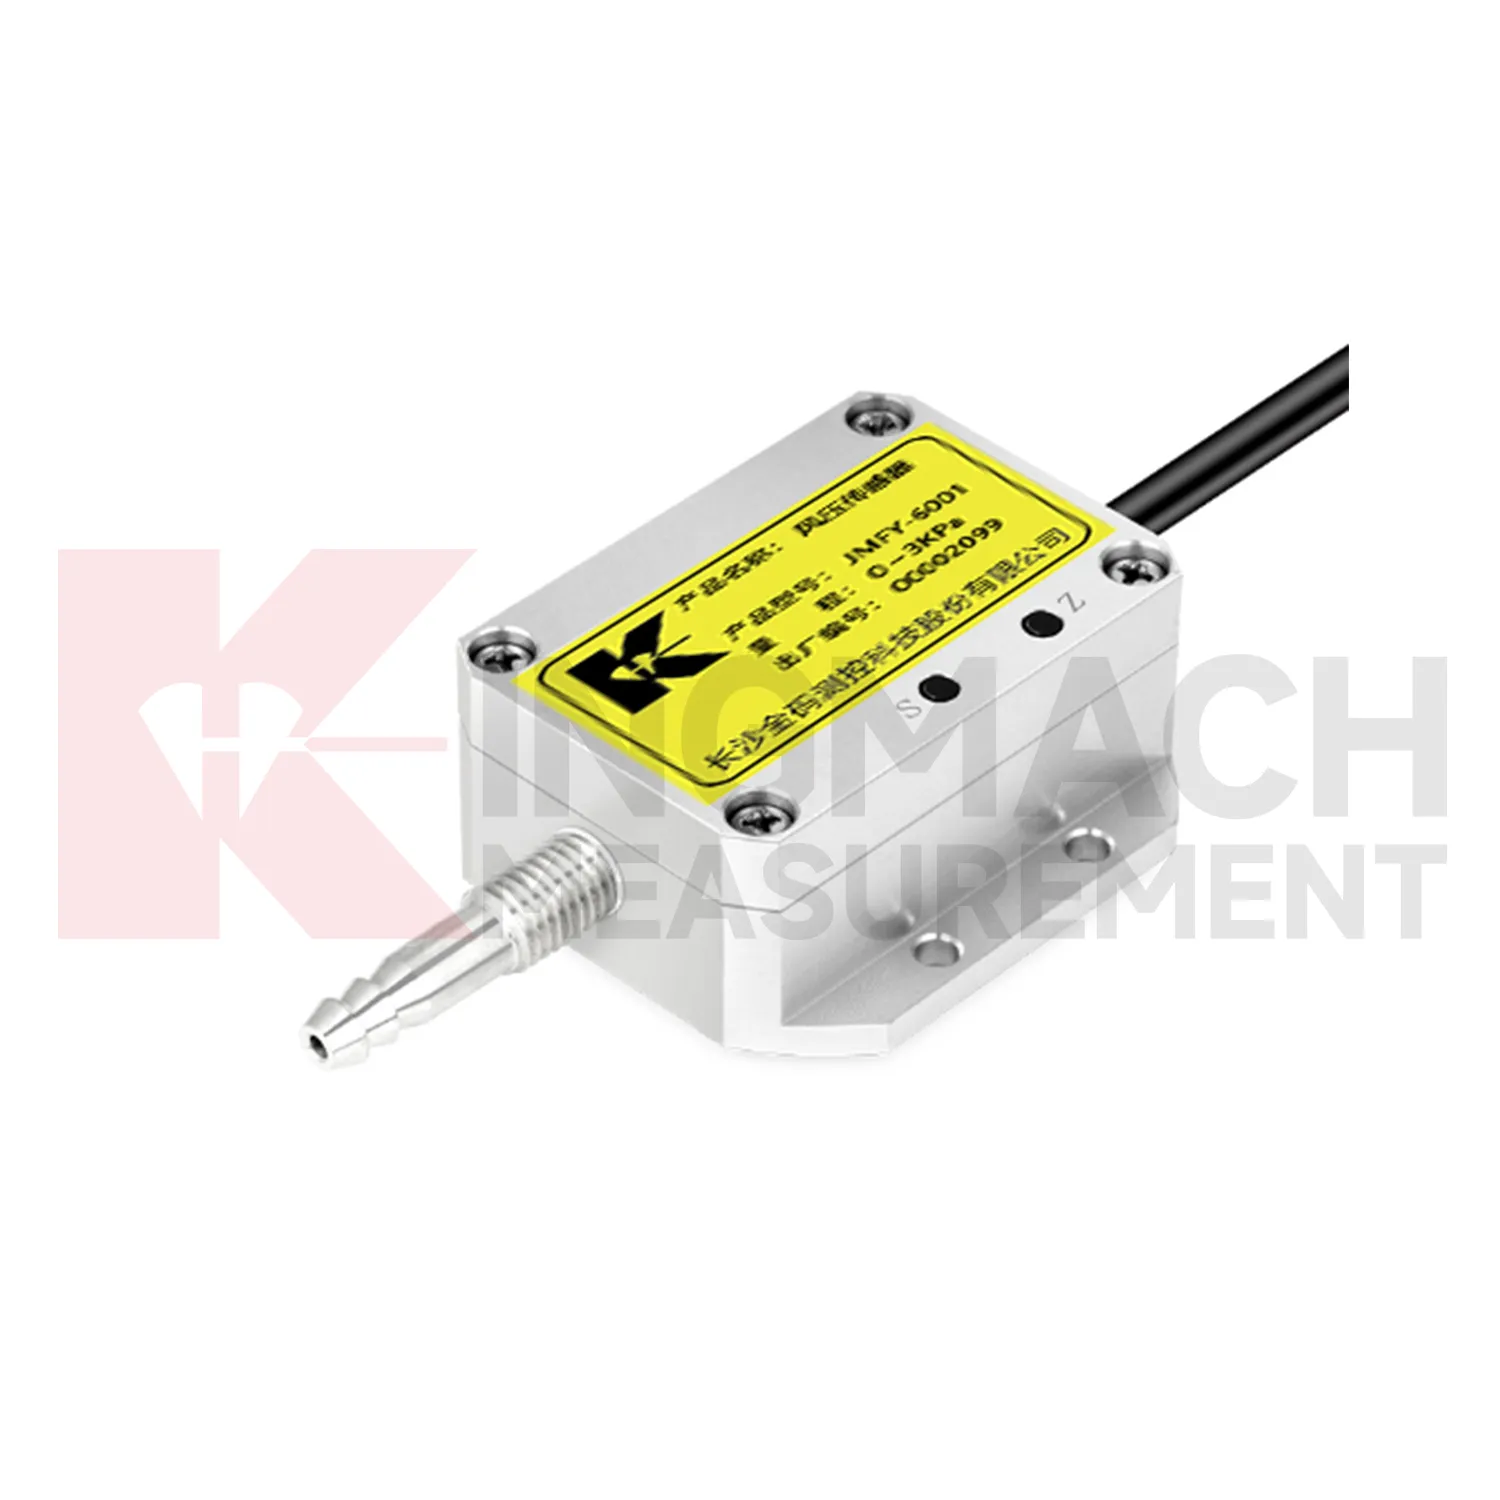
Pressure-channel maintenance for Kingmach Temperature String should keep the pressure path open, clean, and sealed. Tubes, ports, fittings, housings, cables, and power connections should be inspected after storms, dust exposure, washdown, cabinet work, or mechanical impact. Moisture, blockage, loose tubing, or wrong wiring can create readings that look like a pressure event. Pressure data may be reviewed beside wind, airflow, vibration, and structural response, so channel reliability matters. If pressure behavior does not match surrounding conditions, inspect the physical path before assuming the environment changed. A short maintenance note can prevent a long engineering debate later.
During abnormal events, the first question is not only whether the value crossed a limit. The reviewer should ask what changed around the site, whether the related structure reacted, and whether a field inspection confirmed the same pattern.
Long-term value comes from consistency. A channel that keeps the same location, unit, maintenance history, and linked asset record can support seasonal comparison, post-storm review, and handover between construction and operation teams.
Kingmach Temperature String
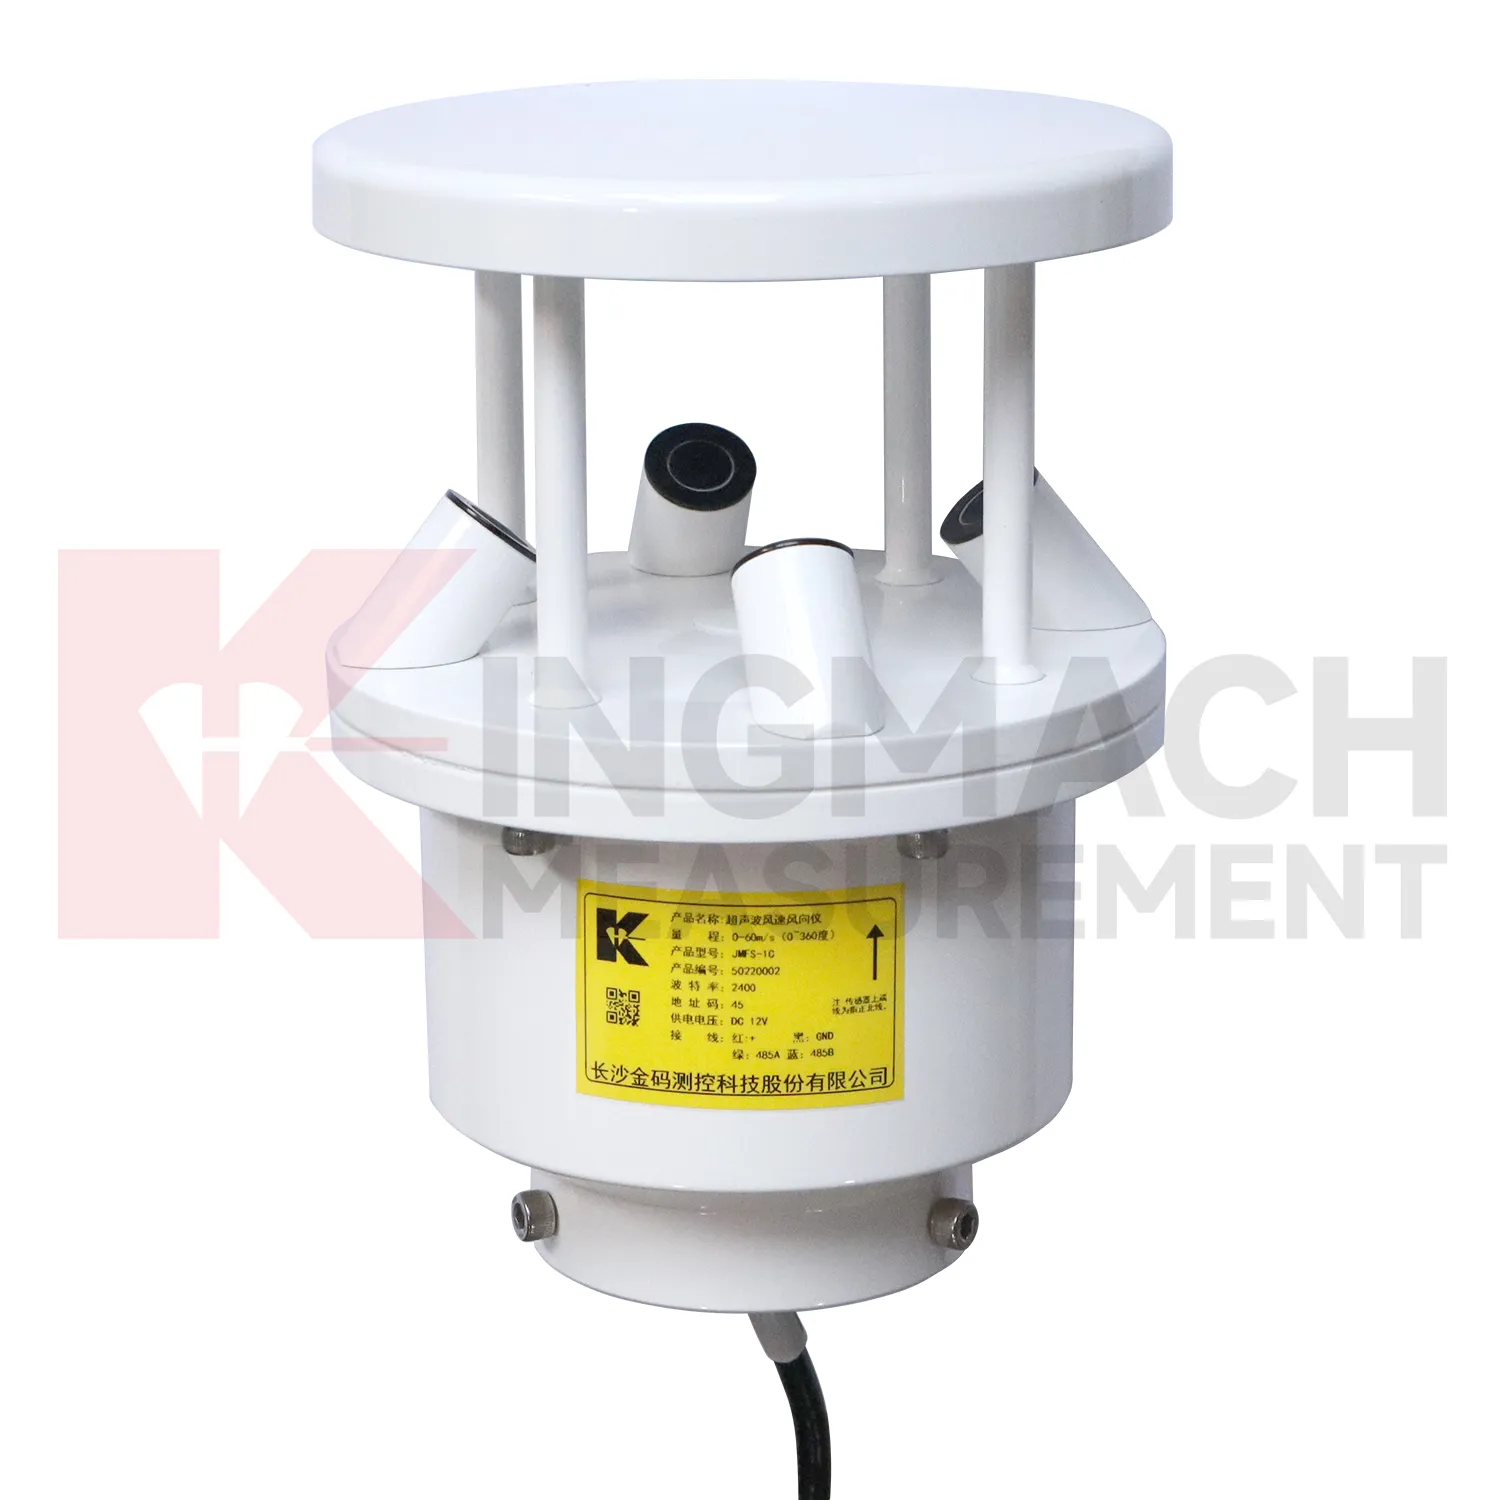
Wind exposure makes Kingmach Temperature String relevant to bridges, towers, airports, marine areas, tunnels, and high outdoor structures. Wind speed, direction, and pressure can affect vibration, access safety, temporary works, lifting operations, and inspection planning. A bridge response during strong crosswind should not be read the same way as a response during calm weather. A tower vibration record means more when the wind direction and timing are known. Wind data should be placed where it represents the monitored asset, with attention to height, obstruction, mounting stability, and cable protection. A clean wind record gives engineers a way to separate normal weather-driven response from behavior that needs a closer structural review.
For field teams, this point is most useful when the record shows the condition before the structural response, during the response, and after the site returns to routine operation. The note should include weather timing, inspection access, nearby construction, and whether the linked structural points changed in the same period.
FAQ
Q: What does Kingmach Temperature String measure?
A: It measures site conditions such as rainfall, wind, temperature, humidity, pressure, and soil wetness so engineers can compare the environment with structural or ground behavior.
Q: Why is this data important?
A: Environmental conditions often explain why deformation, vibration, seepage, cabinet faults, or strain changes occur at a particular time.
Q: Should these records be reviewed alone?
A: No. They are most useful when placed beside settlement, displacement, tilt, load, strain, vibration, inspection notes, and maintenance records.
Q: How should a station be planned?
A: Start with the engineering risk, then decide which condition must be measured, where it should be measured, and which structural record it supports.
Q: What makes a good environmental record?
A: Clear location, correct units, stable placement, protected hardware, time alignment, and visible maintenance notes make the record useful over time.
During abnormal events, the first question is not only whether the value crossed a limit. The reviewer should ask what changed around the site, whether the related structure reacted, and whether a field inspection confirmed the same pattern.
Reviews
Ryan Lewis
Fast delivery and excellent product quality. The accelerometers and tiltmeters are highly reliable. Strongly recommend this company.
Andrew Lee
The visualization software is intuitive and powerful. It helps us analyze monitoring data efficiently.
Latest Inquiries
To protect the privacy of our buyers, only public service email domains like Gmail, Yahoo, and MSN will be displayed. Additionally, only a limited portion of the inquiry content will be shown.
Amelia***@gmail.comSingapore
Hello, I am looking for visualization software for monitoring system data analysis. Please let me kn...
Harper***@gmail.comIndia
Dear Sir, we are planning to procure a complete monitoring system including strain gauges, tiltmeter...
Related product categories
- Temperature Sensor
- Chain-type Temperature Sensor
- Temperature String
- Daisy-Chained Digital Thermometer
- Single-Channel Temperature and Humidity Acquisition Module
- Environmental Monitoring
- Integrated Monitoring Station
- Soil Water Content Sensor
- Ultrasonic Anemometer
- semiconductor temperature sensor
- semiconductor based temperature sensors
- semiconductor temperature sensors